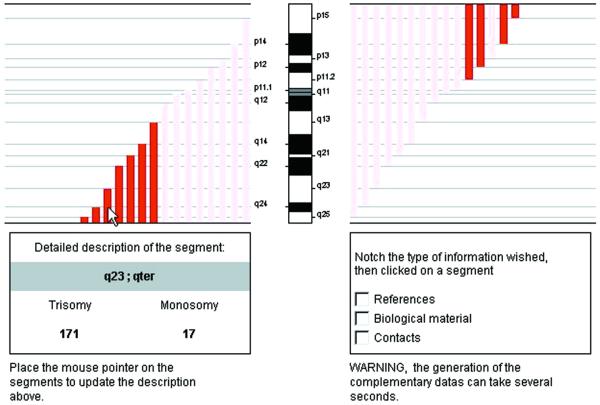
Figure 2.
Example of interface showing the distribution of unbalanced regions of chromosome 11 observed at birth in trisomy and in monosomy. The size of each bar corresponds to the size of the facing chromosomal segment. It is shown in red when a given imbalance is already observed, and in pink if not.

