Figure 6.
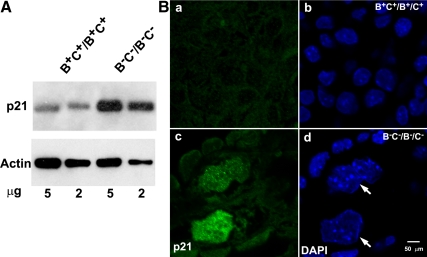
Increased p21 expression in B−C−/B−C− cardiac myocytes. (A) Immunoblot analysis of p21 expression from 5 and 2 μg of E13.5 mouse heart extracts shows increased expression of p21 in B−C−/B−C− hearts compared with B+C+/B+C+ hearts. Actin expression is used as a loading control. (B) Immunofluorescence confocal images of E13.5 heart sections from B+C+/B+C+ (a and b) and B−C−/B−C− (c and d) mice stained for p21 (green). DAPI stains the nuclei (blue). B−C−/B−C− cardiac myocytes (large nuclei) but not the nonmyocytes show increased p21 expression (c, green) compared with B+C+/B+C+ cardiac myocytes (a, green). Note the multilobed nuclei of B−C−/B−C− cardiac myocytes (d, arrows).

