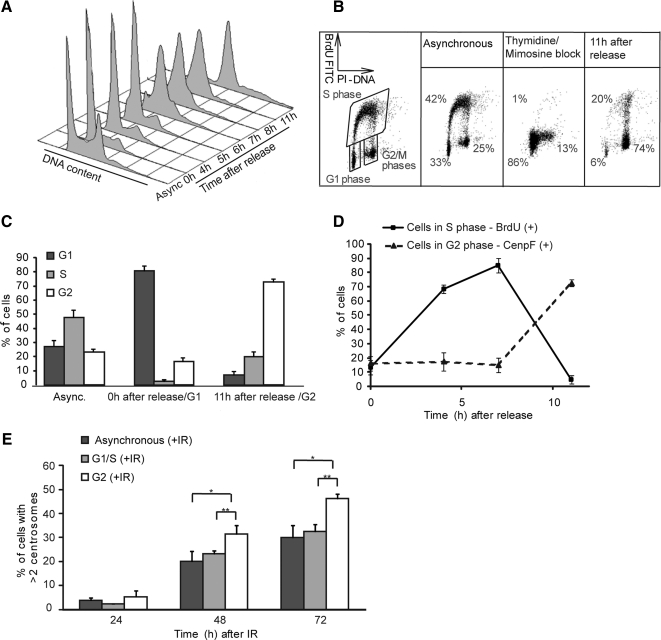
Figure 3.
IR-induced centrosome amplification in synchronized populations of U2OS cells. (A) Cell cycle profile of cells stained with propidium iodide after synchronization and release from a thymidine/mimosine double block method. Async., asynchronous population. (B) Indicative cell cycle profile determination using flow cytometry to quantitate BrdU incorporation. Data shows a representative example of BrdU analysis after block and release. The percentage of cells in G1, S, and G2/M at each time point was calculated as shown. (C) Histogram showing population breakdown by cell cycle stage in unsynchronized, G1-enriched and G2-enriched populations used for fusions. Data are expressed as the means of three independent experiments ± SD. (D) Microscopy analysis of cell cycle status of U2OS cells after thymidine/mimosine block and release. Cells in S phase were assayed by BrdU labeling, and cells in G2 phase were assayed by anti-CenpF antibody staining. Data show the mean ± SD of three separate experiments in which at least 100 cells were scored. (E) Quantitation by γ-tubulin microscopy of centrosome amplification at the indicated times after 5-Gy IR treatment of differently synchronized populations. Data show the mean ± SD of three separate experiments in which at least 100 cells were scored. Statistical significances were calculated by Student's unpaired t test and are indicated on the histogram as *p ≤ 0.1, **p ≤ 0.05, and ***p ≤ 0.01.

