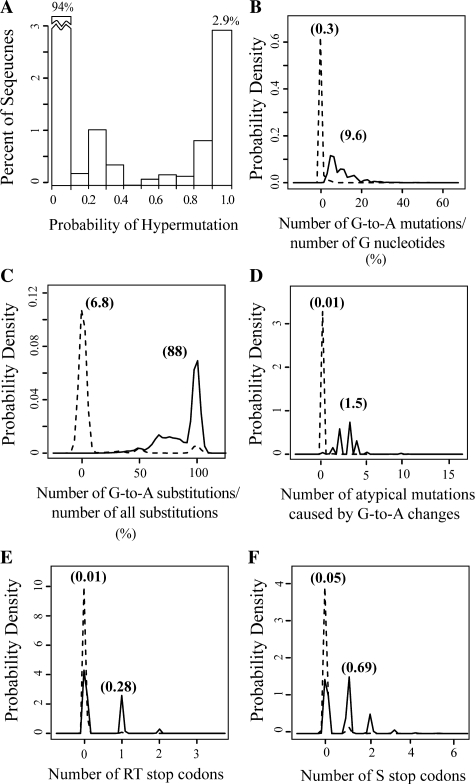
Fig. 1.
Final distributions after application of our EM-based model. (A) The distribution of hypermutation probabilities P(H)Read among the full set of sequence reads. In all, 94% of sequences had hypermutation probabilities of ≤10% and 2.9% of sequences had probabilities ≥90%. (B–F) Probability densities of each of the five classifiers, for sequences classified as non-hypermutated (dashed lines) or hypermutated (solid lines).

