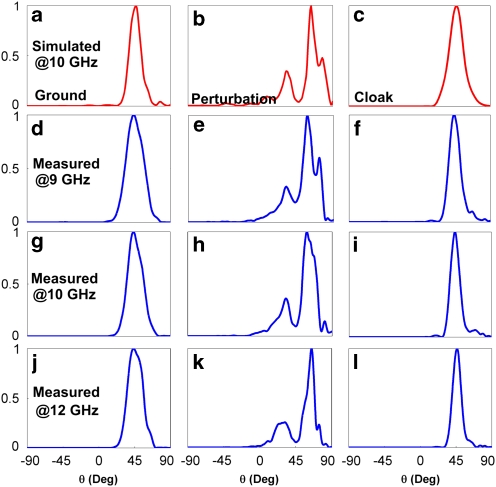
Figure 7. The simulated and measured electric fields in the far region.
The fields are shown at different frequencies under the incidence of perpendicular-polarized electric field emitted from the metamaterial lens antenna. θ is the incidence angle, whereas the electric field amplitudes are normalized to unity. (a–c) Simulated results for the three situations at 10 GHz. (d–f) Measured results for the three situations at 9 GHz. (g–i) Measured results for the three situations at 10 GHz. (j–l) Measured results for the three situations at 12 GHz.

