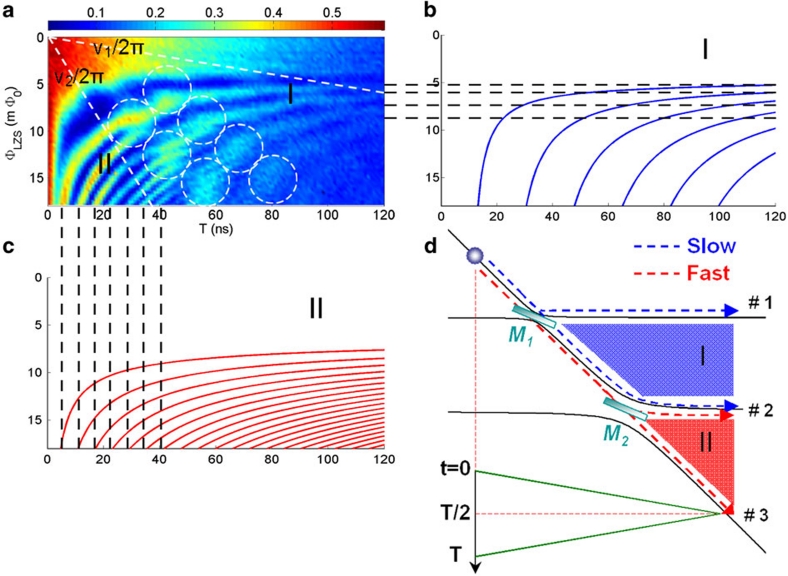
Figure 2. LZS interference in a phase qubit coupled to two TLSs.
(a) The population of |1 measured immediately (a few ns) after the triangular
flux pulse is plotted as a function of the width and amplitude of the triangular flux
bias waveform. The oblique dotted lines are lines of constant characteristic sweeping
rates, ν1 and ν2, defined in the text. The white
circles mark the 'hot spots', where the interference fringes generated by
M2 tend to fade out and the interference fringes generated by
M1 dominate. (b, c) Analytically calculated
constructive interference strips in regions I and II, respectively. The horizontal and
vertical dotted lines indicate the corresponding locations of interference strips.
(b, c) have the same axis labels as (a). (d) Schematic of
generating LZS interference with tunable beam splitters in a phase qubit coupled to two
TLSs. M1 and M2 correspond to the TLSs with smaller
and larger avoided crossings in Figure 1d, respectively.

