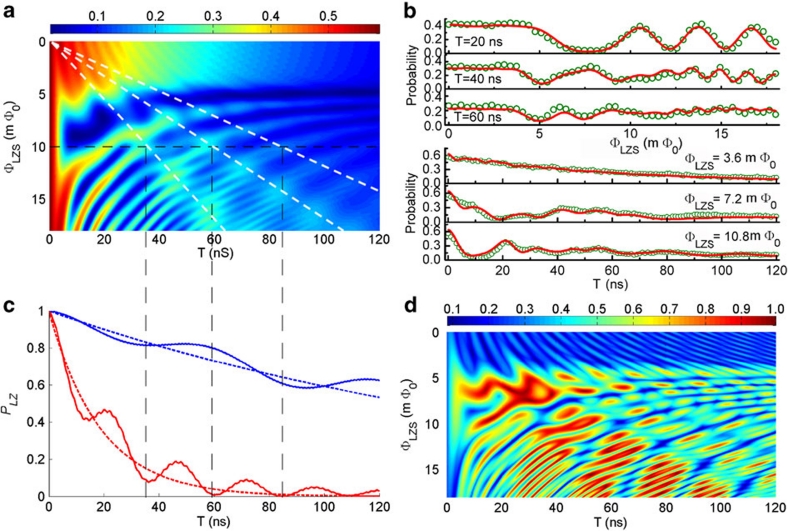
Figure 3. Numerically simulated LZS interference pattern and control of a generalized W state in a phase qubit coupled to two TLSs.
(a) The numerically simulated population of |1 after the triangular flux pulse
is plotted as a function of the width and amplitude of the triangular flux bias. The
horizontal dotted line indicates the location of ΦLZS=10 mΦ0 and
the vertical dotted lines indicate the locations of 'hot spots' at ΦLZS=10
mΦ0. The oblique dotted lines are lines of constant sweeping rate. The
parameters used are determined experimentally: ω01,dc/2π=16.747
GHz,
  GHz/mΦ0,
ωTLS1/2π=16.590 GHz,
ωTLS2/2π=16.510 GHz, Δ1/2π=10 MHz,
Δ2/2π=32 MHz,
  γ(deph)=(45 ns)−1. (b) The upper
panel shows the dependence of population of |1
 on ΦLZS at T=20, 40
and 60 ns, respectively. The lower panel shows the dependence of population of |1
 on
T at ΦLZS=3.6, 7.2 and 10.8 mΦ0, respectively. The
circles represent the experimental data and the lines from the theory. (c) LZ
transition probabilities of M1 (blue line) and M2
(red line) at ΦLZS=10 mΦ0 as a function of pulse width. They are
quite different from the asymptotic LZ transition probabilities (blue dotted line and
red dotted line). (d) The resulting w as a function of T and
ΦLZS.

