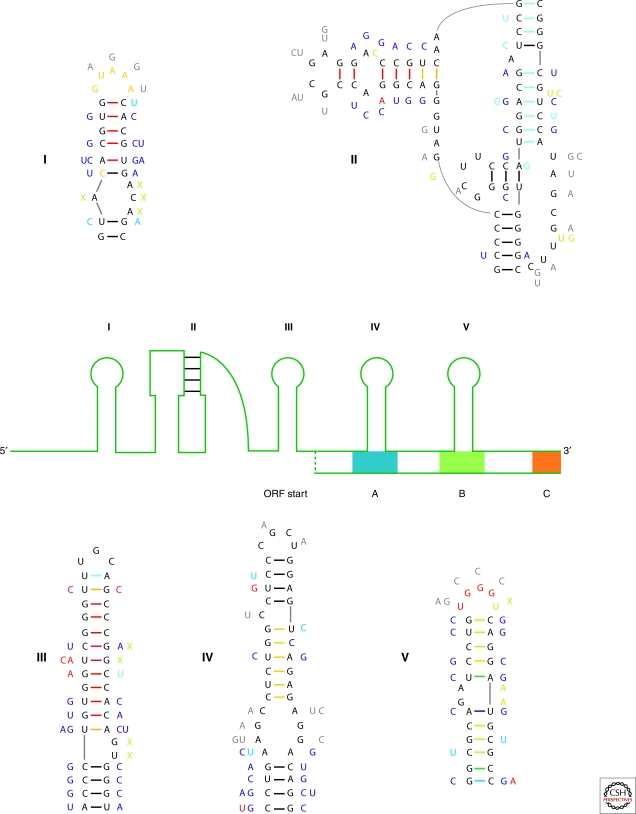
Figure 2.
Determination of Structured Regions of an RNA. A cartoon of the 5′ region of the silk moth R2 retrotransposon is shown. The conserved structure is organized into four hairpin loops (labeled I and III–V) and a pseudoknot (labeled II). Also shown are three conserved coding regions (A–C) and a putative open reading frame (ORF) start site. The five conserved structures are detailed with data that went into the structural modeling. The sequences shown are for B. mori whereas mutations are those that occur in four other moth species. Mutational data appear next to the main sequence and is color annotated: dark blue are double mutations that maintain base pairing (compensatory), light blue are single point mutations that maintain pairing (consistent), gray are mutations in loops, red disrupt canonical base pairs (inconsistent), green are insertions (green X represents a deletion). Experimental mapping is color annotated on the backbone sequence: red are NMIA only modifications and orange are modifications by both traditional mapping agents (DMS or CMCT) and NMIA. Base pairs are indicated with dashes between nucleotides and are color annotated for probability from partition function calculation: Red, probability (P) ≥99%; Orange, 99% > P ≥ 95%; Yellow, 95% > P ≥ 90%; Dark Green, 90% > P ≥ 80%; Light Green, 80% > P ≥ 70%; Light Blue, 70% > P ≥ 60%; Dark Blue, 60% > P ≥ 50%; Black <50%. Many base pairs in the pseudoknot have low probability because the RNAstructure program does not allow pseudoknots and thus, under-counts them in the partition function.

