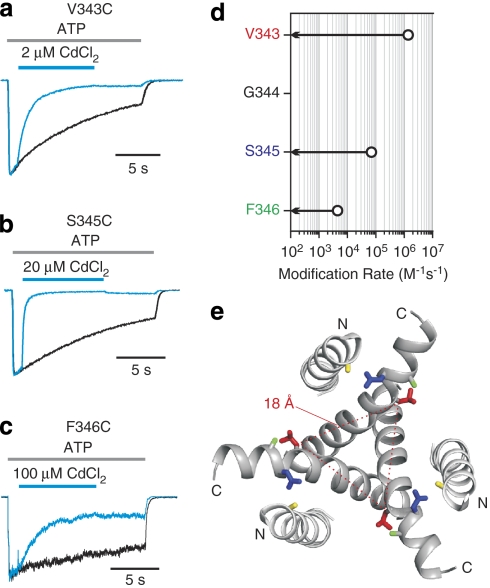
Figure 4. Stable Cd2+ coordination at V343, S345 and F346.
(a) Superimposed scaled current traces show that V343C current is rapidly inhibited by 2 μM CdCl2, and the inhibition recovers slowly after removal of Cd2+. (b) and (c) Superimposed scaled current traces show that S345C and F346C currents are inhibited by applying 20 or 100 μM CdCl2, and the inhibition is only slowly reversible. (d) Summary of stable Cd2+ coordination rates. Open circles represent the stable coordination rates of Cd2+ in the presence of ATP (n=4–6; error bars are s.e.m. and are smaller than the symbols). Arrows indicate that there is no detectable effect of 20 μM CdCl2 on ATP-activated currents when applied for 2 min in the absence of ATP. In all cases, saturating concentrations of ATP28 were used to activate the channel (30 μM for V343C containing channels and 100 μM for S345C and F346C). (e) TM helices viewed from the intracellular side of the membrane. V343, S345, F346 and H33 are labelled in red, blue, green and yellow, respectively. The Cβ–Cβ distance of V343 from three subunits is indicated by dotted lines.

