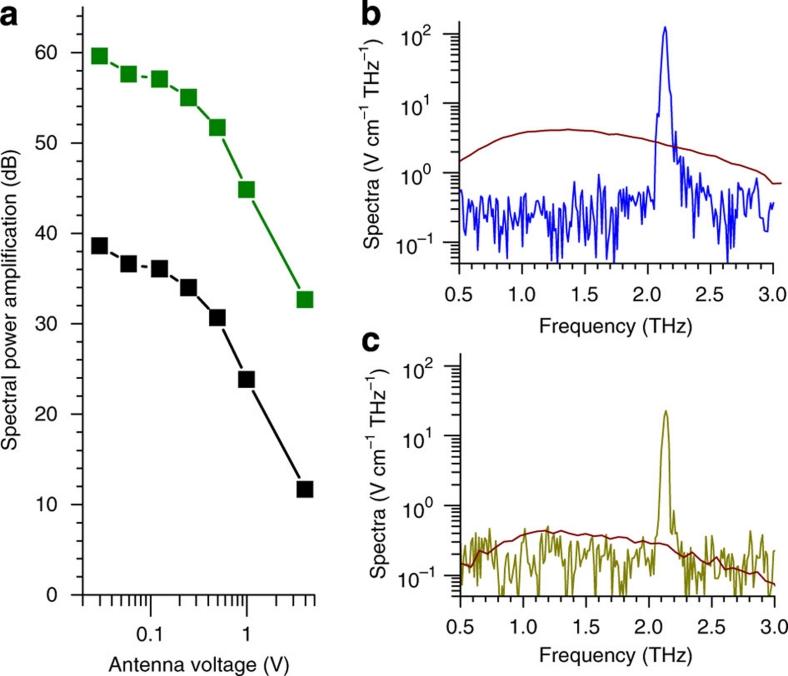
Figure 5. Amplification of the seed pulse.
(a) Power spectral amplification factors for the fields in Figure 4 (from 557 to 608 ps; one round-trip time interval) versus antenna voltage. Green—including input coupling losses. Black—excluding input coupling losses. The THz pulse amplitude is proportional to the antenna voltage. (b) Antenna voltage 0.25 V. Blue curve—spectra of the QCL output from 557 to 608 ps. Dark red curve—spectra of the antenna output with the QCL removed from the setup. (c) Antenna voltage 0.03 V. Dark yellow curve—spectra of the QCL output from 557 to 608 ps. Dark red curve—spectra of the antenna output with the QCL removed from the setup.

