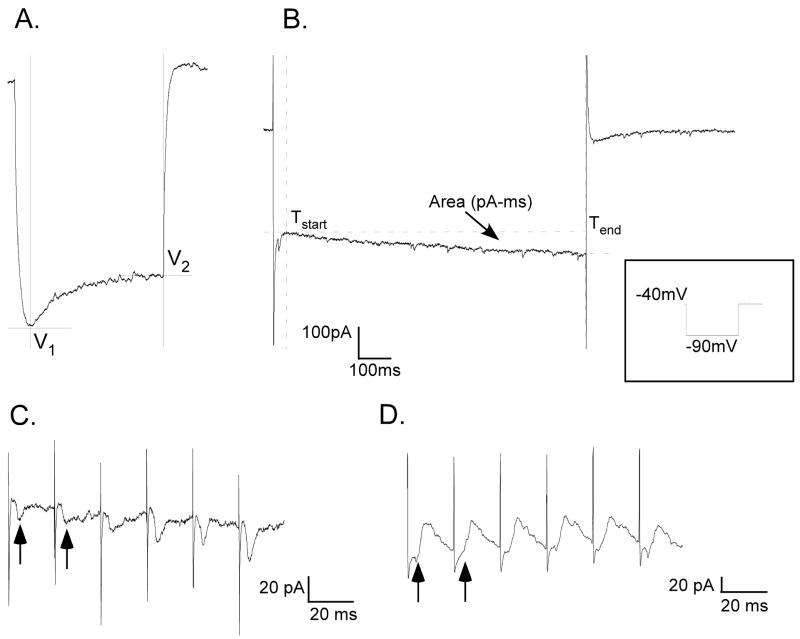
Figure 2.
A. Membrane voltage sag measurements: sag = V2−V1, B. Voltage-clamp recording showing area measurement of slow inward current in response to protocol shown in inset. C. Stimulus-locked inward (excitatory) currents (arrows) evoked by train stimulation in a retrogradely labeled pre-motor IRt neuron. Average response to 10 replications of 50 Hz train, 0.1 ms pulse, 150 μA. D. Stimulus-locked outward (inhibitory) currents (arrows) in another retrogradely labeled IRt neuron. Average response to 10 replications of 50 Hz train, 0.1 ms pulse, 150 uA.

