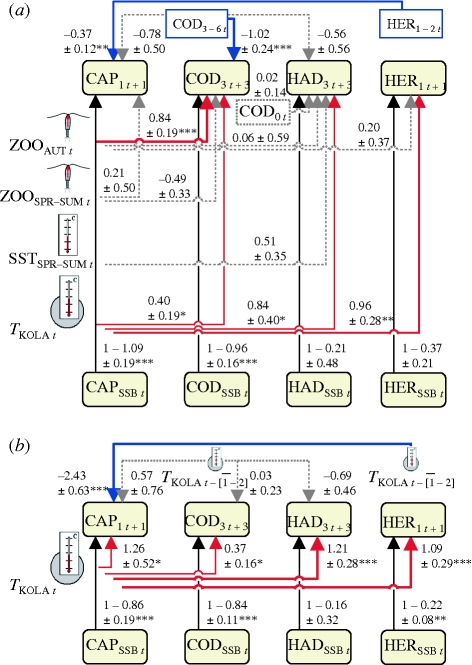
Figure 4.
Effects on population growth, as estimated in spawning stock-recruitment models. (a) Predictor variables selected in stage-wise growth and survival models (figure 3). Regression coefficients with standard errors (s.e.) were estimated using multiple imputation of missing covariate values in order to use all available recruitment data. (b) Climate effects measured by TKOLA in spawning year, or average of 1–2 or 3–6 years preceding spawning, reflecting effects through HER1–2 or COD3–6, respectively. Regression coefficients and s.e. were estimated by least-squares methods. Arrows: red, significantly positive; blue, significantly negative; grey, non-significant effects; line widths and types reflect degrees of statistical support. See electronic supplementary material, appendix S2 for details and table 1 for explanations of variables. Subscript (t) refer to year. *p < 0.05, **p < 0.01, ***p < 0.001.

