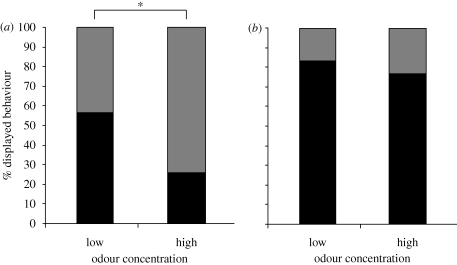
Figure 5.
Effect of food odour concentration on behavioural output. (a) Percentage of tail-flipping and freezing responses to shadows of high contrast that approached with a velocity of 2 m s−1 and low or high (10×) food odour concentration in the tank. The measured differences in behaviour are statistically significant. * = p ≤ 0.05. (b) Percentage of tail-flipping and freezing responses to shadows of high contrast that approached with a velocity of 1 m s−1 and low or high (10×) food odour concentration in the tank. The measured differences in behaviour are not statistically significant. (a,b) Grey bars, freezing; black bars, tail-flipping.

