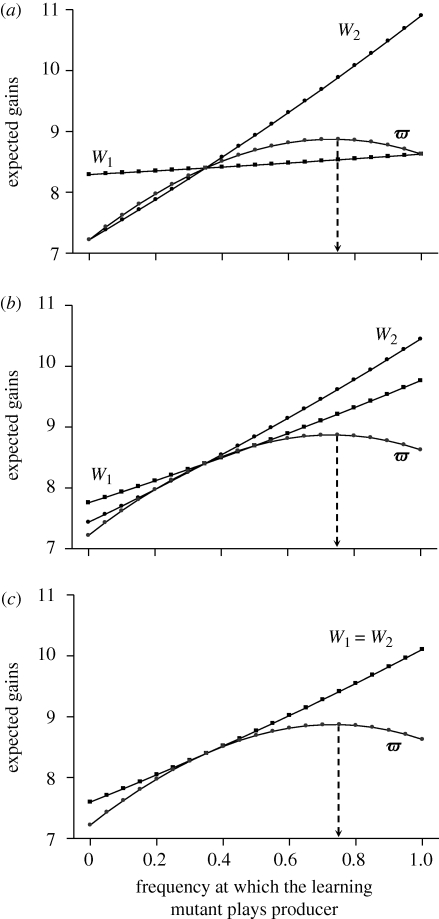
Figure 1.
The gains expected by a fixed individual of type 1 (W1), a fixed individual of type 2 (W2) and the learning mutant (ω) for the first generation, in relation to the frequency at which the mutant uses the producer tactic (αL). In all three panels, T = 1, λ = 2, FM = 12, a = 3, G = 10, DB = 0, DW = 0 and αF(1) = 0.35. In (a) α1 = 1, α2 = 0 and p1 = 0.35. In (b) α1 = 0.5, α2 = 0.2 and p1 = 0.5. In (c) α1 = 0.35, α2 = 0.35 and p1 = 0.5.

