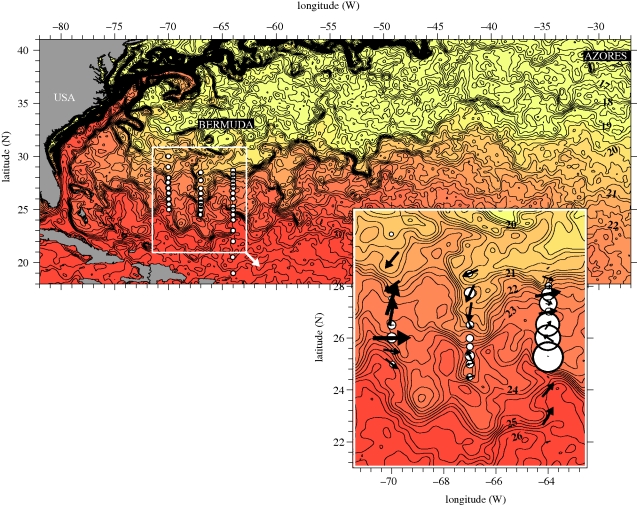
Figure 1.
Satellite image of sea surface temperature, SST, in the western North Atlantic on 4 April 2007. SST are contoured at 0.25°C intervals, closely spaced isotherms indicate frontal bands. Sampling positions are shown by white circles. Inserted enlargement of the study area illustrates relative abundances of A. Anguilla according to circle area, as well as current velocities at 50 m depth according to the size and direction of arrows.

