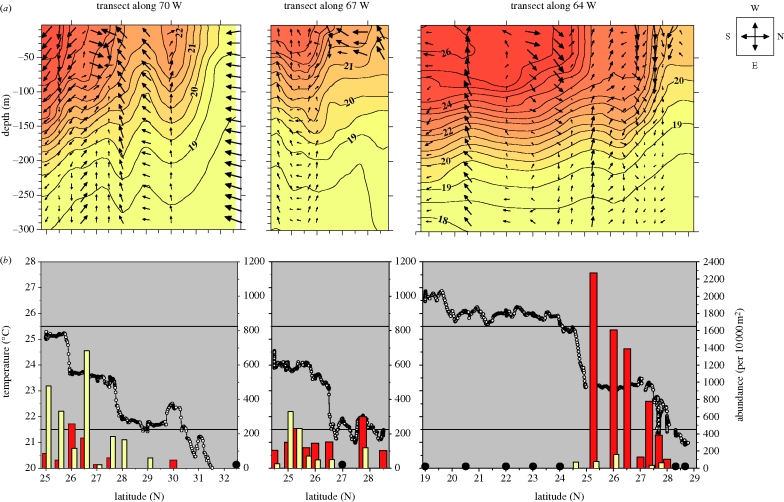
Figure 2.
Observations of hydrography and abundances of eel larvae along transects. (a) Vertical transect profiles of temperature as measured by CTD casts are contoured using 0.5°C isotherms. Direction and velocity of horizontal currents at given depths are shown by arrows. Cardinal directions and an arrow size representing 0.3 m s−1 are illustrated by legend figure to the right of panel; note that along-transect currents (north/south) are illustrated by left/right directed arrows. (b) Underway measurements of SST are indicated by small connected circles. Temperature range from 21.5°C to 25.5°C is indicated by full lines. Abundances of eel larvae are shown by height of bars; note scale differences between transects. Estimates of zero abundance are indicated by large, black circles. Red bar, A. Anguilla; yellow bar, A. rostrata.

