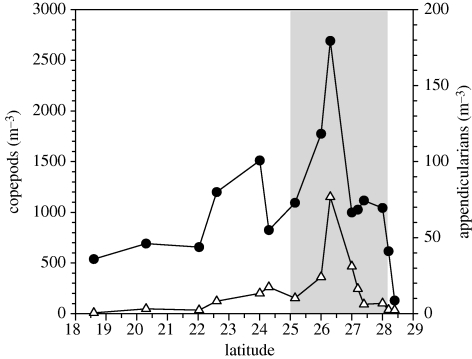
Figure 4.
Densities of potential prey to the eel larvae. Densities of appendicularians (triangles) and copepods (circles) in the 50–200 depth stratum. All species and stages are combined for each group. Shaded area illustrates the frontal zone, as it is indicated by the temperature range in figure 2b.

