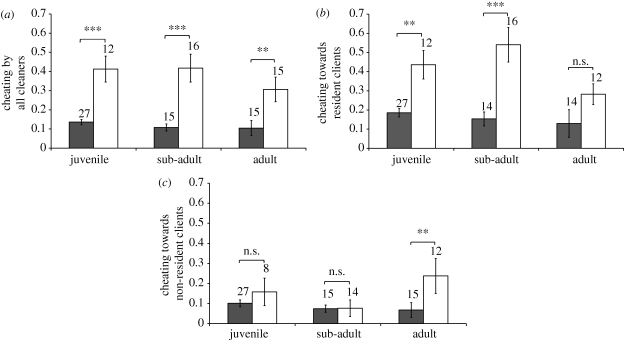
Figure 2.
Prevalence of cheating (measured as the proportion of inspected clients that jolted) to (a) all clients combined, (b) clients with access to a single cleanerfish (residents) and (c) clients with potential access to more than one cleanerfish (non-residents) for cleanerfish of different species (L. dimidiatus: filled bars; L. bicolor: open bars) and age classes. Sample sizes are indicated above each bar. ***p < 0.001, **p < 0.01 and n.s. = p > 0.05 from MANOVA simple-effects analyses.

