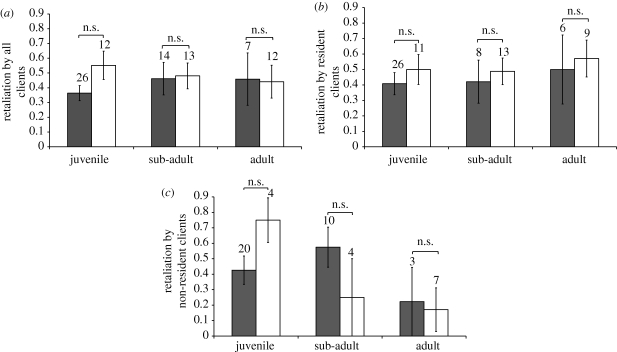
Figure 3.
Prevalence of punishment (measured as the proportion of jolting clients that chased the cheating cleanerfish) by (a) all cheated clients combined (b) cheated clients with access to a single cleanerfish (residents, filled bars) and (c) cheated clients with potential access to more than one cleanerfish (non-residents, open bars). Bar heights and errors represent back-transformed mean ± 1 s.e. n.s. = p > 0.05 from MANOVA simple-effects analyses.

