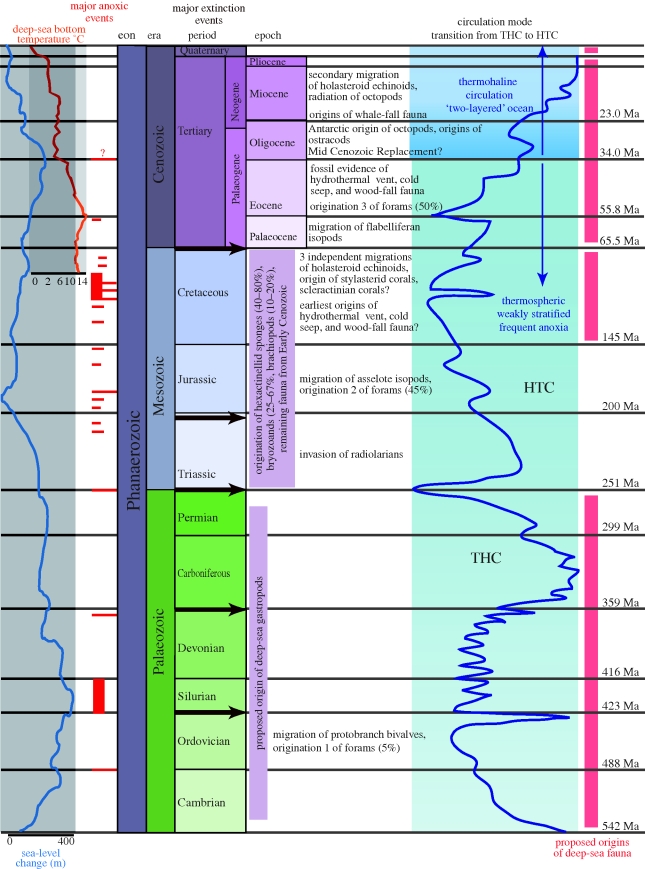
Figure 2.
The geological, biological, chemical and physical history of the deep sea. Figure shows from left to right sea-level change in metres (light blue line); deep-sea bottom temperate in degrees celsius (orange line); major anoxic events (dark red blocks, width denotes regional vs. global); major extinction events (grey arrows within timescale), major migrations of fauna into the deep (text); circulation mode (dark blue line) and proposed origins of deep-sea fauna (light red blocks). Data for figure come from (Menzies & Imbrie 1958; Clarke 1962; Bensen 1975; Allen 1978; Lipps & Hickman 1982; Jeppsson 1990; Jacobs & Lindberg 1998; Horne 1999; Wilson 1999; Rogers 2000; Waelbroeck et al. 2001; Little & Vrijenhoek 2003; Smith & Stockley 2005; Kiel & Goedert 2006; Linder et al. 2008; Strugnell et al. 2008).

