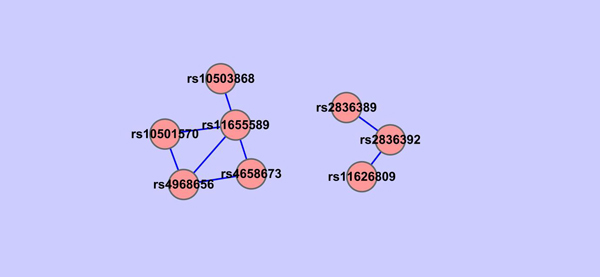
Figure 14.
SNPs network when GOSemSim threshold=0.27. SNPs network constructed using Cytoscape. For each group of the gene network where gene pairs have > 0.27 similarity value, all the pairwise SNP-SNP interactions are checked using PLINK between SNPs involved in the groups of genes and all the other SNPs selected by the shrunken method. SNPs network is constructed based on the P value of PLINK epistasis test. Each node in the figure is labeled as its SNP ID and the edge between two SNPs indicates whether this pair of SNPs are interacted under a P < 0.01 significance. There are 2 SNPs networks in this figure.

