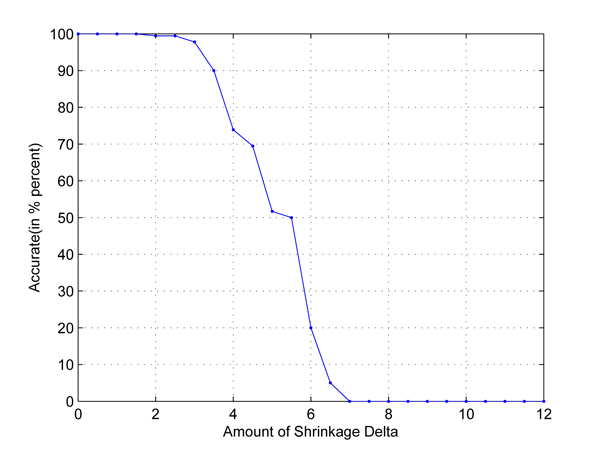
Figure 5.
CEU-YRI classification. Two populations: CEU and YRI out of the 4 populations in HapMap data set are picked out to set up a two-class classification. The X axis is the amount of shrinkage Δ and Y axis is the accuracy (accuracy refers to the correctly classified samples in testing data sets in the 10-fold cross validation) obtained by using our shrunken method.

