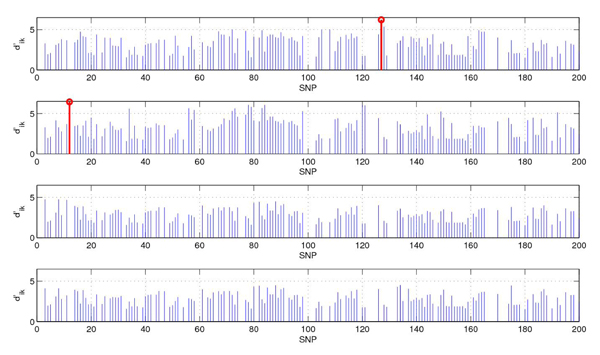
Figure 7.
The values of soft threshold. The SNPs used in prediction and their values of  (from top to bottom are: CEU, YRI, CHB, JPT, Δ = 1.5). The values of
  in blue in the figure mean that its corresponding SNP appears in all four populations, while the values of
  in red represents its corresponding SNP shows in only one population.

