
Fig. 2.
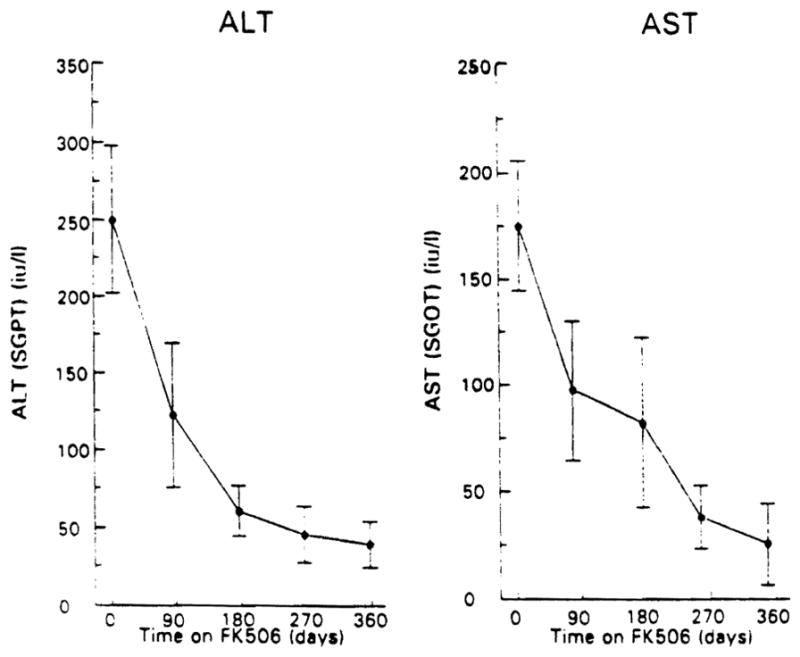
Serum ALT and AST levels with increasing time through 1 yr on FK 506 in the 10 subjects studied. The points are mean values; the brackets represent the SEM.
Official websites use .gov
A
.gov website belongs to an official
government organization in the United States.
Secure .gov websites use HTTPS
A lock (
) or https:// means you've safely
connected to the .gov website. Share sensitive
information only on official, secure websites.
Serum ALT and AST levels with increasing time through 1 yr on FK 506 in the 10 subjects studied. The points are mean values; the brackets represent the SEM.