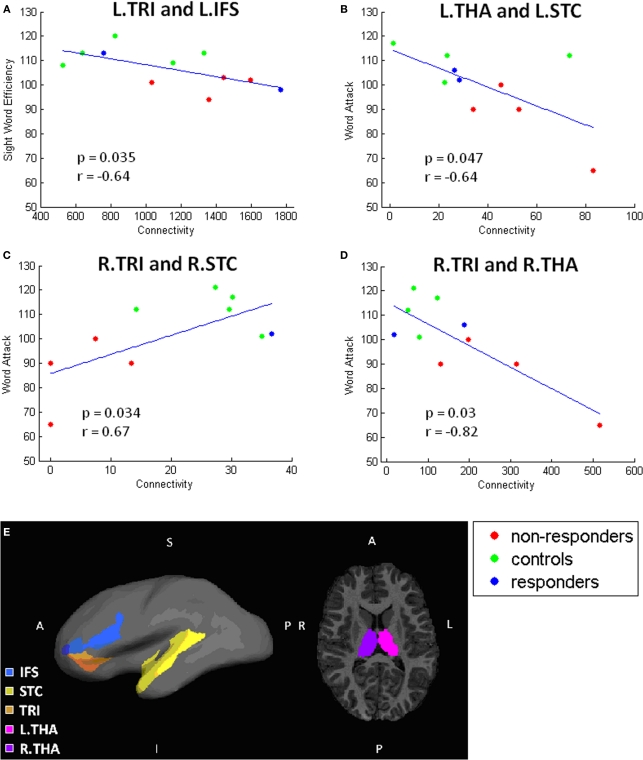
Figure 6.
Remaining significant correlations. Scatterplots showing correlations between connectivity and behavioral test performance. Each scatterplot corresponds to one pair of gray matter regions: (A) L.TRI and L.IFS, (B) L.THA and L.STC, (C) R.STC and R.TRI, (D) R.THA and R.TRI. Locations of these regions are illustrated in (E).

