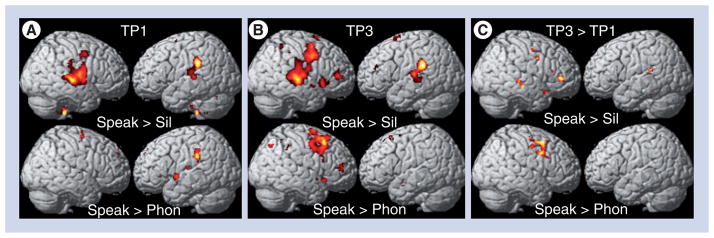
Figure 1. Functional MRI activation maps (superimposed onto the surface projections of a spatially-standardized normal brain) of a patient treated with melodic intonation therapy.
Presents the contrast ‘overt speaking versus silence (control condition)’ in the top row and ‘overt speaking versus vowel production’ in the bottom row (p < 0.05 family-wise error) (A) before therapy and (B) after therapy, as well as (C) a voxel-by-voxel comparison of the two time-points. The color codes represent different magnitudes of activation: the color yellow indicates stronger activation than the color red. All comparisons are thresholded at p < 0.05 (family-wise error corrected). For more details on the functional MRI tasks and functional MRI data analysis, see [46]. Phon: Phonation of vowels; Sil: Silence; Speak: Speaking; TP1: Before therapy; TP3: After therapy; TP3 > TP1: Voxel-by-voxel comparison of the two functional MRI acquisitions.

