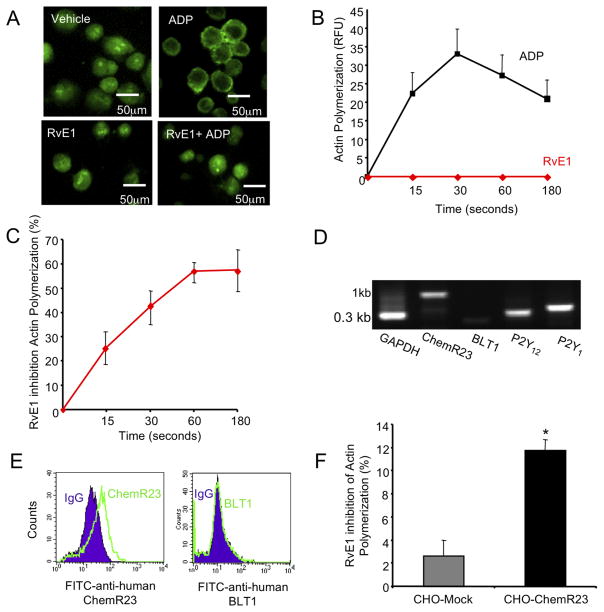
Figure 3. RvE1 reduces ADP-stimulated actin polymerization in MEG-01.
(A–C) MEG-01 cells (1×10⁵/treatment) were cultured and stimulated with vehicle, ADP (10 μM), RvE1 (100 nM) and ADP plus RvE1 for 0, 15, 30, 60 or 180 seconds, 37°C. Actin polymerization was visualized via fluorescent microscopy (Nikon Eclipse E600 and imported into Spot Diagnostic analysis software) (C) or quantified via flow cytometry (D,E). (A) Images are representative of n=3 and (B,C) values are mean ± SEM of n=3. (D) Representative gel of P2Y12, P2Y1, ChemR23 and BLT1 expression. Note that all products were 0.3kb with the exception of full-length human ChemR23, which was 1kb. (E) MEG-01 surface expression of ChemR23 (left, solid line) or BLT1 are shown as compared to their respective isotype matched controls (shaded). (F) Mock pcDNA3 or hChemR23 was transiently transfected into CHO cells using Lipofectamine 2000 for 48 hours, 37°C. CHO-Mock (grey bar) or CHO-hChemR23 (black bar) cells (1×10⁵) were stimulated with RvE1 (10 nM) 15 minutes prior to ADP (10 μM) stimulation (60 minutes, 37°C). FITC-phalloidin fluorescence was assessed via an EnVision plate reader and software. Values are mean ± SEM of n=3, *p<0.01.

