Figure 5.
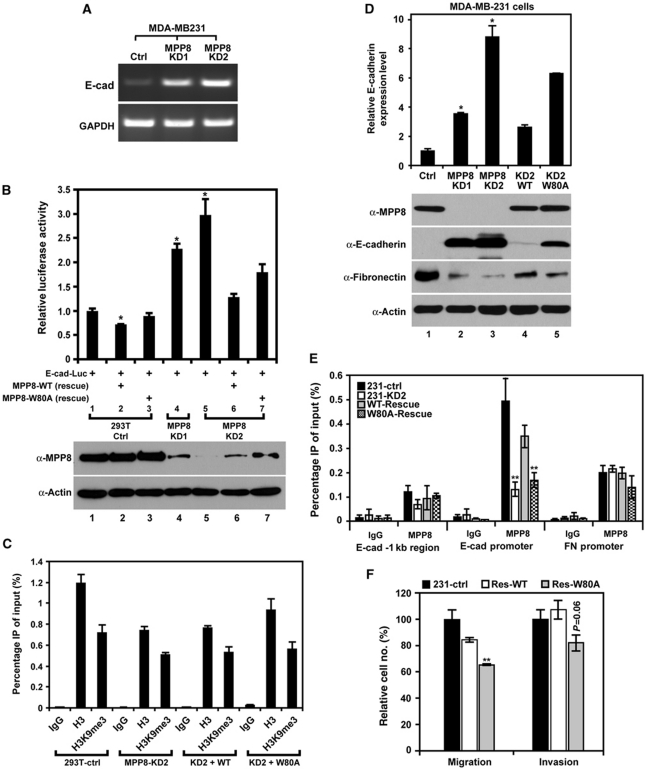
MPP8 represses E-cadherin gene expression. (A) E-cadherin mRNA levels in control and two MPP8 stable knockdown MDA-MB-231 cells were assayed with RT–PCR. GAPDH serves as controls. (B) MPP8 represses transcription from E-cadherin promoter. As indicated below each column, mock, and MPP8 knockdown 293T cells were transfected with E-cad-Luc (−420∼+23) luciferase reporter with or without MPP8-wt or W80A rescue construct. The luciferase activity of reporter alone was normalized as 1. Results are the mean of three independent experiments with s.d. (error bars). MPP8 expression was analysed by western blot. (C) ChIP analysis using H3K9me3- and H3-specific antibodies. qPCR was conducted using primers specific for exogenous E-cad-Luc promoter and chromatin derived from control, MPP8 knockdown and rescue 293T cells. Graphs show the mean of ChIP enrichment values (n=3) with s.d. (error bars). (D) RT–qPCR (top) and western blot (bottom) analysis of control, MPP8 knockdown and rescue MDA-MB-231 cells. Antibodies are indicated, and qPCR results were derived from three independent samples (±s.d.) and normalized to GAPDH. (E) ChIP–qPCR analysis using anti-MPP8 antibody and primers specific for E-cadherin (E-cad) promoter or Fibronectin (FN) promoter using chromatin derived from control, MPP8 knockdown and rescue MDA-MB-231 cells. Graphs show the mean of ChIP enrichment values (n=3) with s.d. (error bars). (F) Migration and invasion assays of control and MPP8 rescue MDA-MB-231 cells. Columns represent the mean of triplicate assays with s.d. (error bars). Control cells were normalized as 100%. In all panels, ‘*' represents P-values <0.01 and ‘**' represents P-values <0.05.

