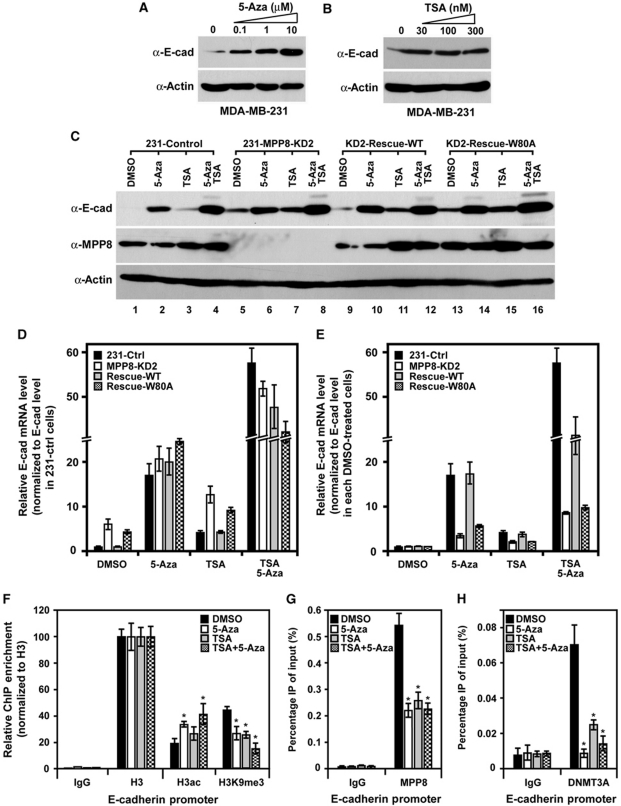
Figure 8.
MPP8 represses E-cadherin expression through DNA methylation. (A, B) Western blot analysis of MDA-MB-231 cells treated with different amount of 5-Aza (A) for 96 h or TSA (B) for 24 h. (C) Western blot analysis of control, MPP8 knockdown and rescue MDA-MB-231 cells treated with 5-Aza (10 μM, 96 h), TSA (100 nM, 24 h) or both inhibitors. (D) Real-time RT–qPCR analysis of E-cadherin mRNA level in control, MPP8 knockdown and rescue MDA-MB-231 cells treated with 5-Aza, TSA or both inhibitors. E-cadherin expression was normalized to GAPDH expression and E-cadherin mRNA level in control MDA-MB-231 cells with DMSO treatment was normalized as 1. Graphs show the mean of relative E-cadherin mRNA level (n=3) with s.d. (error bars). (E) The same RT–qPCR results as (D), but E-cadherin expression in each DMSO-treated cells was normalized as 1 to assess the effect of different inhibitors in each assayed cells. (F–H) ChIP–qPCR analysis using H3ac, H3K9me3 (F), MPP8 (G) and DNMT3A (H) specific antibodies and chromatin derived from MDA-MB-231 cells treated with DMSO, 5-Aza, TSA or both inhibitors. qPCR was conducted using primers specific for E-cadherin promoter. Graphs show the mean ChIP enrichment values (n=3) with s.d. (error bars). In all panels, ‘*' represents P-values <0.01.

