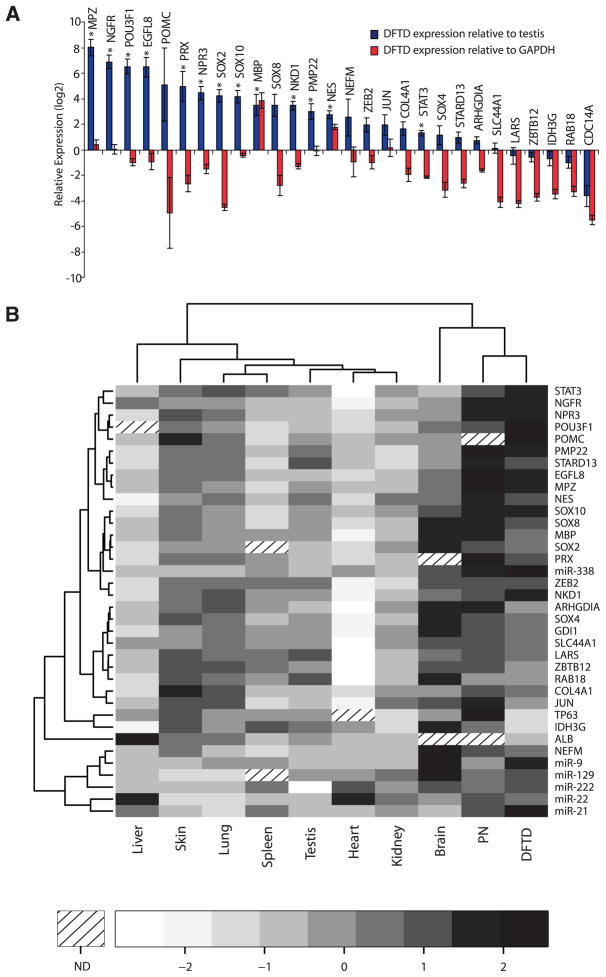
Fig. 2.
DFTD transcriptome. (A) Semiquantitative RT-PCR expression profiling of 31 genes with enriched expression in tumor relative to testis [454–read count fold change ≥2.5, P ≤ 0.05, chi-squared test; (green points in fig. S5)]. Log values of the mean expression difference of DFTD genes relative to testis (blue bars) and relative to GAPDH (red bars) are shown. Error bars represent standard deviation. Significant differences between tumor and testis expression levels (P ≤ 0.05) are indicated by an asterisk (two-sample t test, Holm’s correction for multiple testing). (B) Heat map of semiquantitative PCR expression profiles of 31 genes across a panel of tissues including peripheral nerve (PN), a Schwann cell–enriched tissue. Panel color represents the mean gene expression level, standardized across tissues (z score). Hierarchical clustering based on Pearson’s correlation statistic is indicated by dendrograms. For each tissue three biological replicates were performed (n = 3). ND, not determined.

