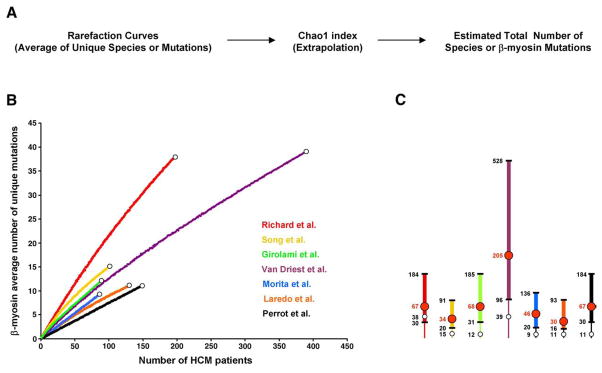
Fig. 1.
Estimation of β-myosin mutations richness. (A) Flow chart of the community ecology methods employed in this study. (B) Individual rarefaction curves derived from seven independent studies are depicted in different colors. White dots correspond to the total number of unique mutations experimentally found. (C) Graphic representation of the total number of estimated β-myosin mutations derived from each study. Intervals (95% confidence) are shown by thicker lines. Red numbers/dots correspond to the estimated mean number of mutations. White dots correspond to the total number of unique mutations experimentally found. Rarefaction curves employed to estimate the average number of unique β-myosin mutations were calculated by randomly resampling the mutation population 100 times, according to Simberloff [12]. The validity of this approach is based on the assumptions that the population is infinite, and the patients enrolled in each study represent a random sample of the total number of people with cardiomyopathy (random spatial distribution of individuals). Since the prevalence of familial hypertrophic cardiomyopathy in the global population is 0.2%, we believe that the resulting FHCM population, corresponding to about 1.3×10⁷ individuals, is large enough to satisfy the first assumption. Since patients examined and genotyped were mainly Europeans and Americans they do not represent an equiprobable sampling. Based on this limitation, the resulting analyses should be considered approximate estimates (see text for discussion). EstimateS [http://viceroy.eeb.uconn.edu/EstimateS] was used to extrapolate the population size of β-myosin mutations. (For interpretation of the references to colour in this figure legend, the reader is referred to the web version of this article.)

