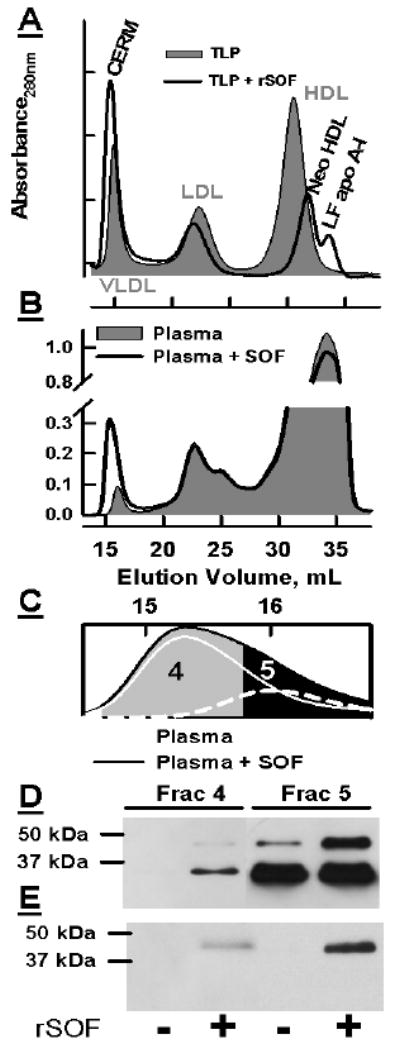
Figure 1.

A and B, respectively: SEC of TLP and plasma before (grey fill) and after (black curve) incubation with rSOF. C: Expansion of the SEC profile to show separation of VLDL and CERM in rSOF-treated plasma. Dashed line, plasma VLDL; white line ,CERM, the difference between plasma and rSOF-treated plasma. D and E: Immunoblots of fractions 4 and 5 probed with anti apos E and A-II respectively.
