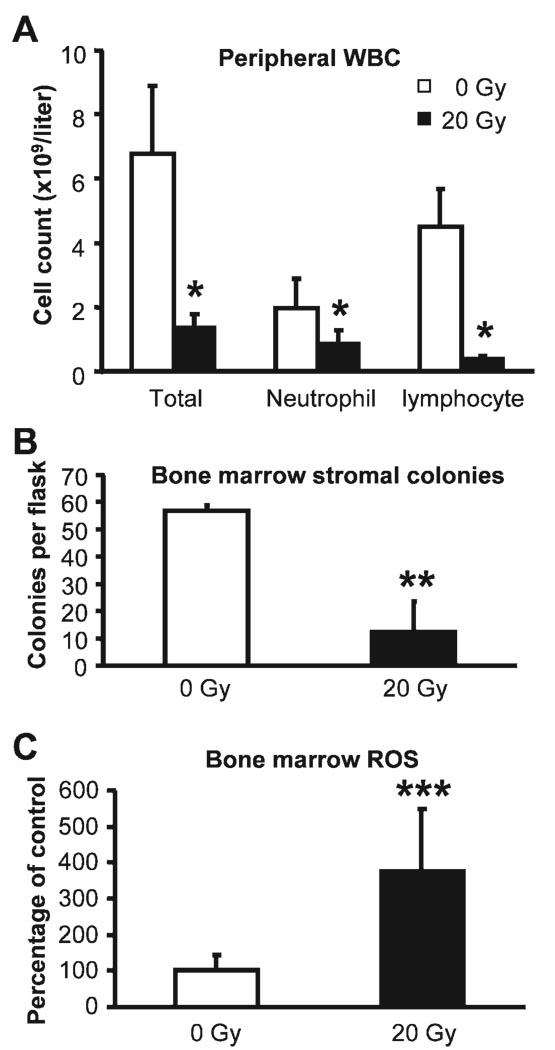
FIG. 5.
Peripheral white blood cell counts (panel A), ex vivo bone marrow stromal colony formation (panel B), and bone marrow ROS measurements (panel C) 6 days after abdominal irradiation. ROS measurements were normalized to cell number and expressed as percentages of the levels in the controls. Data are means and standard deviations. *P < 0.001 (n = 10–12); **P < 0.01 (n = 3); ***P < 0.01 (n = 8).

