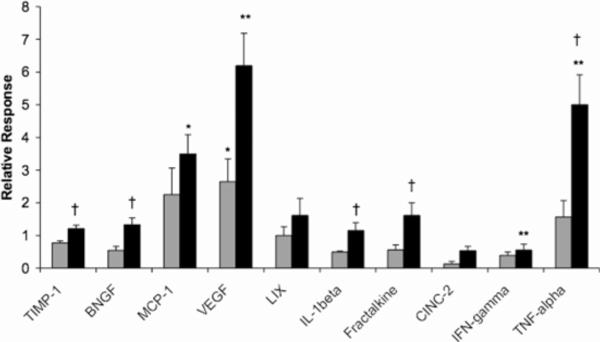
Figure 5.
Modulation of relevant cytokine and chemokine levels in response to methamphetamine intake. Sera samples analyzed were obtained from ShA rats (grey) and LgA rats (black) self-administering methamphetamine 1 h daily and 6 h daily, respectively, for a period 87 days. Data is expressed as mean fold-increase over drug naïve levels ± SEM. * p<0.05, ** p<0.01, significance in change compared to drug naïve levels. † P<0.05, H0: LgA>ShA. Reproduced with permission from Proc. Natl. Acad. Sci. USA.45

