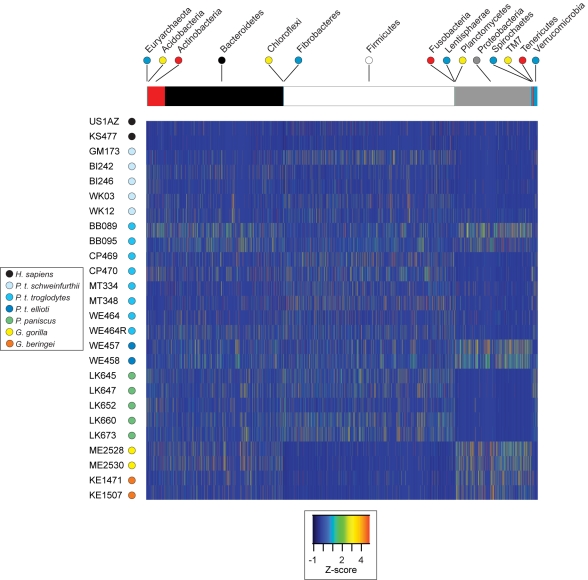
Figure 2. Relative abundance of microbial species across great ape hosts.
Rows represent samples (color-coded by host species as in Figure 1); columns represent microbial species (reproducible 99.5% OTUs; n = 8,914). Microbial phyla represented in the gut microbiota of these hosts are shown horizontally across the top: OTUs classified to one archaeal (Euryarchaeota) and 14 bacterial phyla, as indicated. Based both on the number of OTUs and on read counts, species classified as Bacteroidetes, Firmicutes, and Proteobacteria are the most dominant phyla in these samples. Samples from four chimpanzees (BB089, BB095, WE457, and WE458) have more proteobacterial reads than do other chimpanzee samples, and samples from both gorilla species contained relatively fewer Firmicutes species than did samples from other ape species. Individual cells are color-coded by Z-scores to show the normalized abundance of a particular OTU in one sample relative to the mean abundance across all samples. Intensity of the colors indicates how many standard deviations the observed OTU abundance is above or below the mean.

