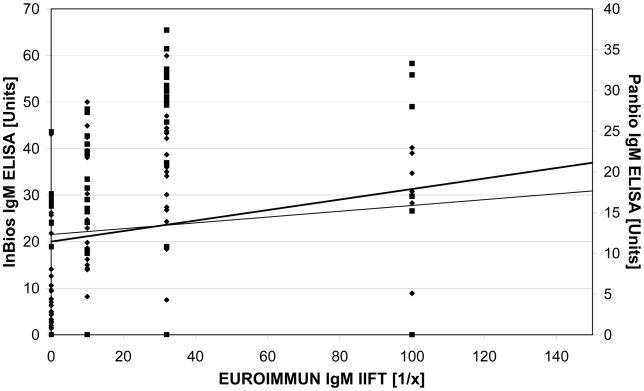
Figure 1. Scatter blot comparing the results of the InBios and the Panbio IgM capture ELISA with the results of the EUROIMMUN IgM IIFT.
To facilitate the readability one IIFT outlier (1∶320) was taken out of the diagram. Test values: Panbio IgM capture ELISA results (▪), InBios IgM capture ELISA results (⧫). Trend line: Panbio IgM capture ELISA results (thin), InBios IgM capture ELISA results (thick).

