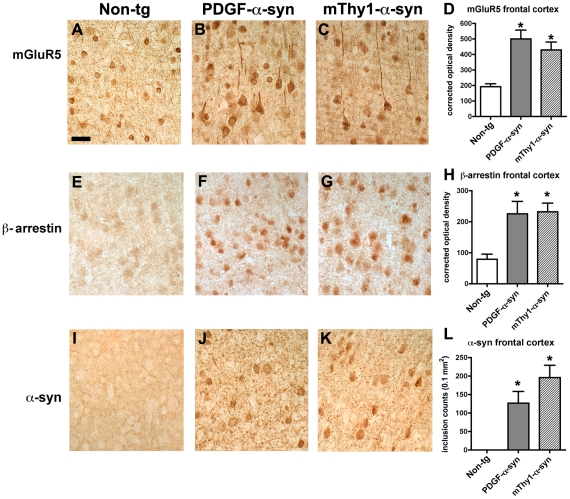
Figure 3. Immunohistochemical Analysis of mGluR5, beta-arrestin and alpha-syn in the frontal cortex of alpha-syn transgenic mice.
(A, B, C) Representative bright field microscopy images of mGluR5 immunoreactivity in the frontal cortex of non-tg, PDGF-alpha-syn and mThy1-alpha-syn tg mice, respectively. (D) Analysis of mGluR5 immunoreactivity in the frontal cortex of non-tg, PDGF-alpha-syn and mThy1-alpha-syn tg mice. (E, F, G) Representative bright field microscopy images of beta-arrestin immunoreactivity in the frontal cortex of non-tg, PDGF-alpha-syn and mThy1-alpha-syn tg mice, respectively. (H) Analysis of beta-arrestin immunoreactivity in the frontal cortex of non-tg, PDGF-alpha-syn and mThy1-alpha-syn tg mice. (I, J, K) Representative bright field microscopy images of alpha-syn immunoreactivity in the frontal cortex of non-tg, PDGF-alpha-syn and mThy1-alpha-syn tg mice, respectively. (L) Analysis of alpha-syn immunoreactivity in the frontal cortex of non-tg, PDGF-alpha-syn and mThy1-alpha-syn tg mice. Scale bar = 30 µM. * Indicates a significant difference between alpha-syn tg mice compared to non-tg controls (p<0.05, one-way ANOVA and post hoc Fisher) (n = 8 cases per group).

