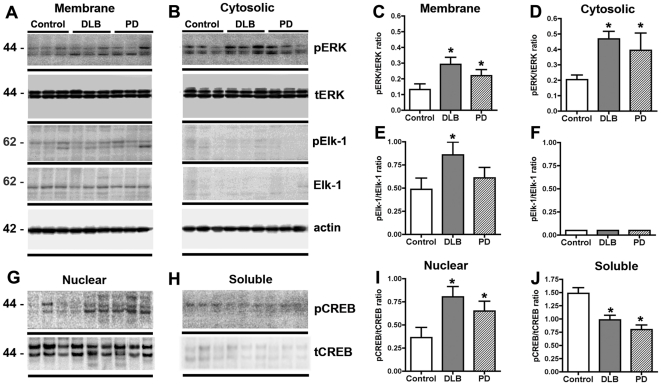
Figure 6. Immunoblot analysis of ERK, Elk-1 and CREB activity in Control, DLB and PD cases.
(A) Representative immunoblot of phospho-ERK (pERK), total ERK (tERK) phospho-ELK-1 (pELK-1) and total ELK-1 (tELK-1) expression levels in the membrane fraction from the frontal cortex of control, DLB and PD cases. (B) Representative immunoblot of pERK, tERK, pELK-1 and tELK-1 expression in the cytoplasmic fraction from the frontal cortex of control, DLB and PD cases. (C) Analysis of ERK activity (pERK/tERK ratio) in the membrane fraction. (D) Analysis of ERK activity (pERK/tERK ratio) in the cytosolic fraction. (E) Analysis of Elk-1 activity (pElk-1/tElk-1 ratio) in the membrane fraction. (F) Analysis of Elk-1 activity (pElk-1/tElk-1 ratio) in the cytosolic fraction. (G) Representative immunoblot of phospho-CREB (pCREB) and total CREB (tCREB) in the nuclear fraction from the frontal cortex of control, DLB and PD cases. (H) Representative immunoblot of pCREB and tCREB in the soluble fraction from the frontal cortex of control, DLB and PD cases. (I) Analysis of CREB activity in the nuclear fraction. (J) Analysis of CREB activity in the soluble fraction. * Indicates a significant difference between DLB or PD cases compared to control cases. (p<0.05, one-way ANOVA and post hoc Fisher) (n = 8 cases per group).

