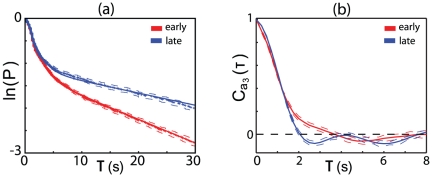
Figure 7. Adaptation of foraging behavior.
(a) The cumulative distribution of times between reorientation events in wild–type worms. Reorientation events are defined as described in the text, and dashed lines denote bootstrap standard deviations. (b) The temporal correlation of the third eigenmode,  , between reorientation events, for early and late times.

