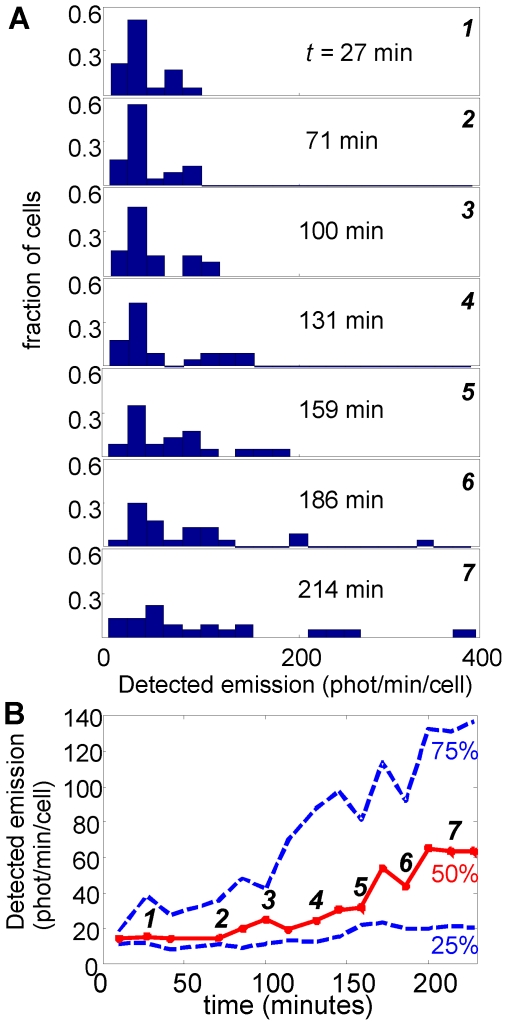
Figure 4. Spreading of the luminescence histogram over time.
(A) Cell brightness histograms for MJ11 cells at the indicated times, following introduction of 1000 nM AI at t = 0. (B) Median (red curve) cell brightness and the 25% and 75% percentiles of brightness (blue curves). The distribution of intensities broadens as the cells response to the exogenous AI signal. A substantial fraction of the cells emit near the detection threshold (∼10–20 photons/minute/cell) even at t = 4 hrs.

