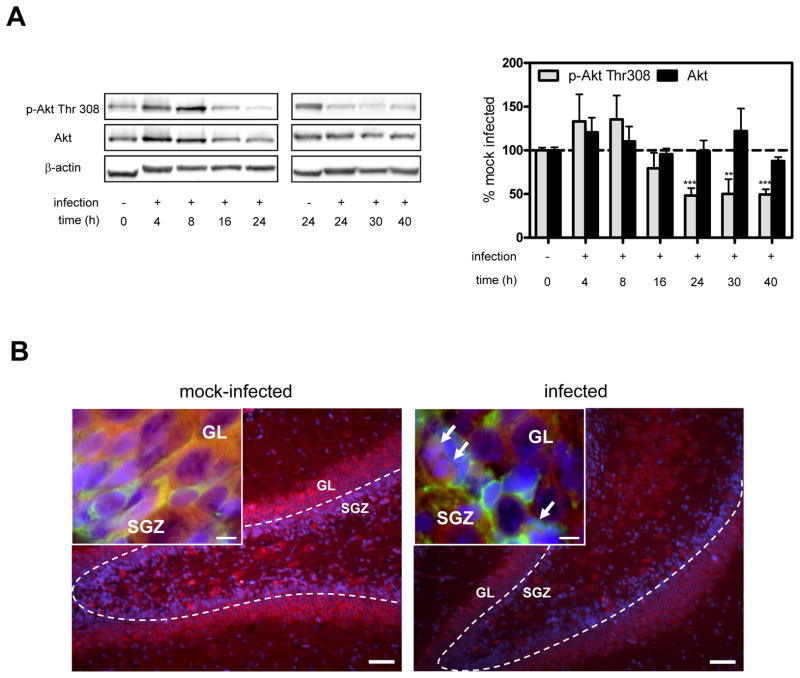
Figure 1. Kinetics and cellular localization of hippocampal Akt phosphorylation during pneumococcal meningitis.
(A) Representative Western blot for phospho-Akt (Thr308) and Akt. Bar graph shows results of the densitometric analysis of the bands corrected for β-actin. Data represent the mean ± SEM from 4–10 individual animals per time point and are expressed as the percentage relative to mock-infected animals (=100%). Since basal levels of phospho-Akt and Akt in mock-infected animals remained unchanged at 24 h, values were incorporated into t=0. **P<0.01, ***P<0.001 vs. mock-infected. (B) Staining for phospho-Akt Thr308 (red) and DAPI (blue) in the granular layer (GL) and subgranular zone (SGZ) of the hippocampal dentate gyrus. Scale bar 50 μm. Insets show images taken at the intersection between SGZ and GL. Doublecortin-positive cells (green) mark the end of the SGZ. Arrows point to morphologically apoptotic cells. Scale bar 10 μm. Images are representative of stainings obtained in sections prepared from at least 3 different animals per experimental group.

