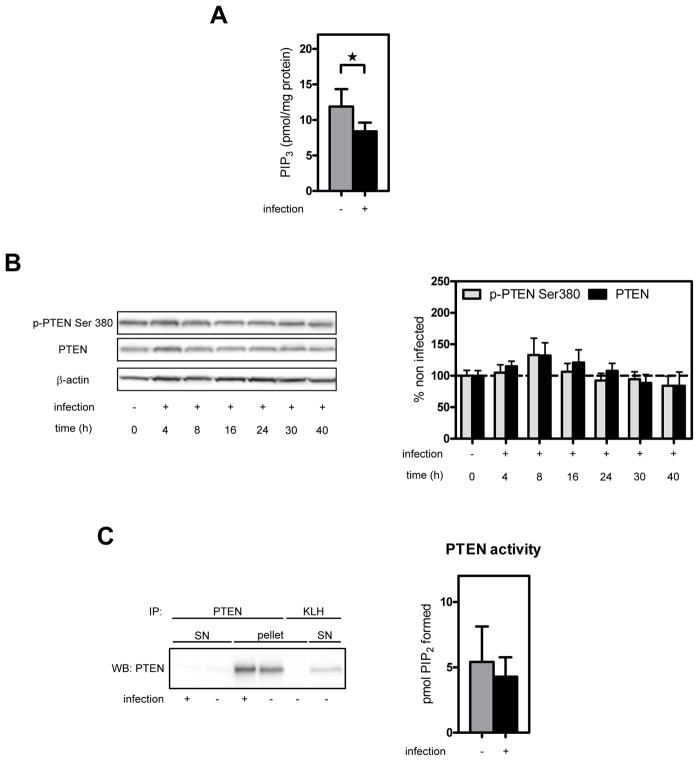
Figure 2. Effect of pneumococcal meningitis on hippocampal PIP3 levels, PTEN phosphorylation and PTEN phosphatase activity.
(A) Endogenous PIP3 levels were measured in hippocampal lipid extracts prepared at 24 h p.i.. Bar graph shows PIP3 levels expressed per mg protein as mean ± SD (n=5 each). *P<0.05. (B) Hippocampal homogenates were analyzed for PTEN Ser380 phosphorylation and total PTEN at different time points after infection by Western blot analysis. Representative blot is shown. Bar graph shows results of densitometric analysis of bands from 4–9 individual animals per time point corrected for β-actin. Data are expressed as the percentage of the mean ± SEM of mock-infected animals (=100%). P>0.05 vs. mock-infected (t=0). (C) PTEN was immunoprecipitated under non-reducing/non-oxidizing conditions from hippocampal homogenates prepared at 24 h p.i.. An anti-key limpet hemocyanin antibody (KLH) was used as a negative control for immunoprecipitation. Representative blot is shown. PTEN activity of the immunoprecipitate was determined by measuring PIP3 to PIP2 conversion. Activity was adjusted for the amount of PTEN, and results are presented as mean ± SD. No significant difference between infected (n=8) and mock-infected (n=9) animals.

