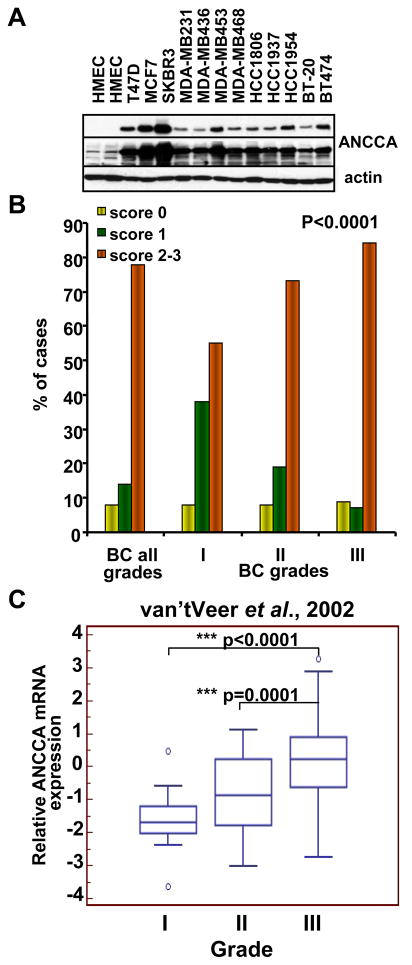
Figure 2.
ANCCA overexpression in breast cancer cell lines and its correlation with tumor grades. A, Western analysis of ANCCA in normal HMEC and different breast cancer cell lines. Top and middle panels, a short and long exposure respectively. B, representative anti-ANCCA IHC images of normal and tumor tissues with different grades. C, distribution of tumors with low (yellow), moderate (green) and high (orange) expression of ANCCA in breast carcinomas of different grades (P < 0.05). D, box-and-whisker plot of ANCCA mRNA expression in tumors of different grades analyzed using www.oncomine.org.

