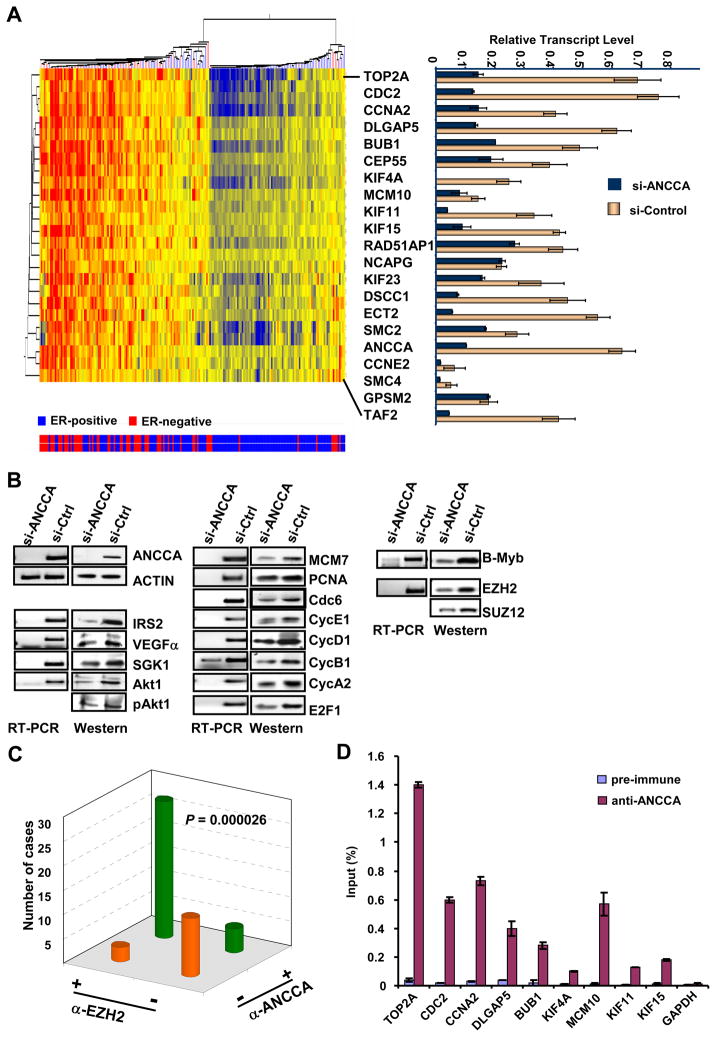
Figure 5.
ANCCA controls key regulators of cell proliferation and survival pathways including the oncogene EZH2. A, unsupervised hierarchical clustering of the expression of the top 20 genes (25 probesets, not including ANCCA) found to be co-expressed with ANCCA overexpression in a data set of 198 patients (12). Correlation coefficients (by Spearmann’s test) for the similarity of each gene’s expression to that of ANCCA expression and other information are indicated in Supplementary Fig. 9. Tumor ER status is indicated below by blue bars for ER+ tumors (total of 134) or red bars for ER- tumors (total of 64). Right panel, MDA-MB468 cells were transfected with siRNA targeting ANCCA (dark blue) or control sequence (yellow) and harvested 48 hrs later for real-time RT-PCR analysis. Relative transcript levels were obtained by normalization of expression units for each gene with that of GAPDH. B, MDA-MB 468 cells were treated as above and analyzed by RT-PCR or Western. C. The anti-ANCCA and anti-EZH2 immunoreactivity of a TMA section was scored negative if less than 10% of the epithelial cells displayed any staining, and scored positive if more than 10% of the epithelial cells displayed staining with moderate to high intensity. The association between the different antibody staining was analyzed using Pearson’s χ2 test. D. ChIP with control serum and anti-ANCCA antibody was performed with MDA-MB-468 cells. ChIP DNA was analyzed by real-time PCR. Anti-ANCCA enrichments are presented as percentage of input.

