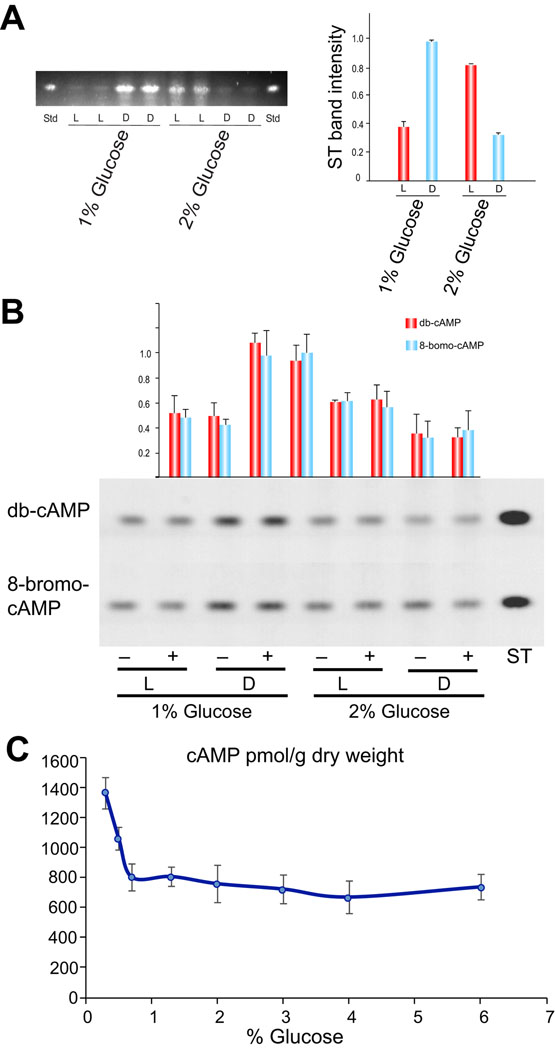
Figure 1. Effect of light and glucose on ST production in A. nidulans and study of possible connections with cAMP levels.
A) Thin-layer chromatography analysis of ST produced by the wild-type A. nidulans FGSCA4 strain on GMM with 1% or 2% glucose cultured in light and dark conditions after 5 days of incubation. ST, standard. The densitometry was carried out with Scion Image Beta 4.03 software. The ST band intensity values were normalized with respect to the highest intensity considered as 1. B) Effect of db-cAMP and 8-bromo-cAMP supplementation on ST production. Thin-layer chromatography analysis of ST produced by the wild-type A. nidulans FGSCA4 strain. Four- hundred µM of db-c-AMP or 8-bromo-cAMP was added to the medium before inoculation. ST was extracted after 3 days of cultivation. C) Internal cAMP levels measured in strain FGSCA4 when growing in GMM cultures with different glucose concentrations. The error bars in graphs from panel A indicate standard error.

