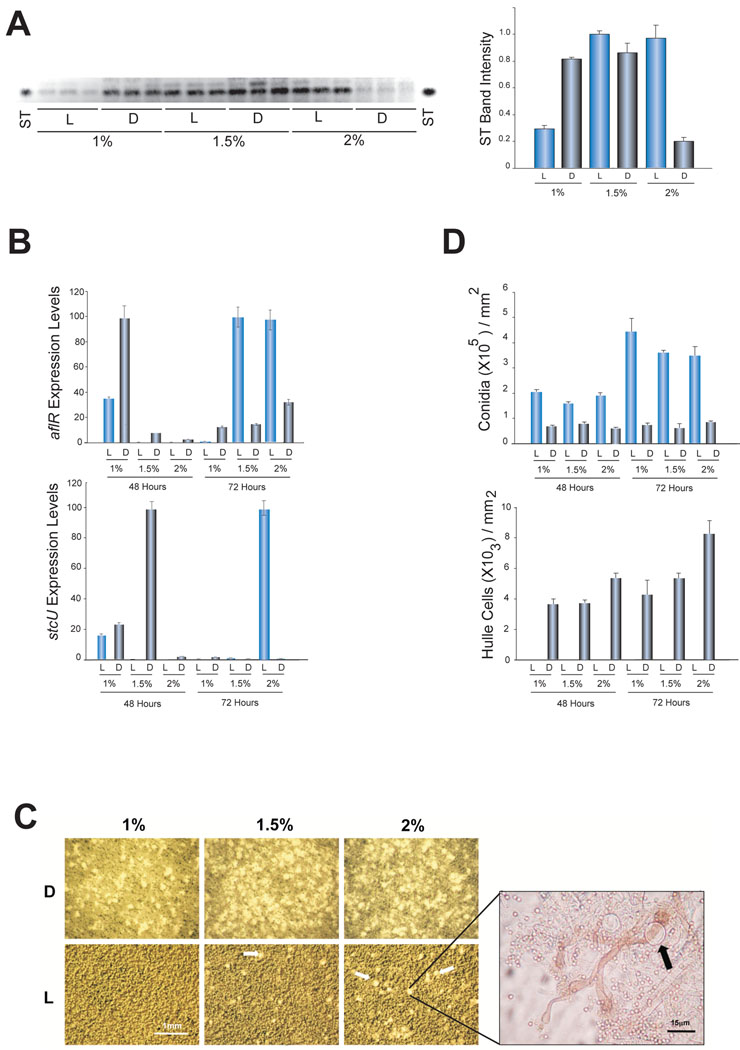
Figure 4. Effect of light and glucose on wild-type ST gene expression, ST accumulation and morphogenesis.
A) TLC analysis of ST from strain FGSCA4 grown for 96 hours on supplemented minimal media with the indicated percentage of glucose as main carbon source. On the right, densitometry showing the intensity of the ST bands. The densitometry was carried out using the Scion Image 4.03 software. B) qRT-PCR results showing expression levels of aflR and stcU genes. The relative expression levels were calculated using the method described by Kenneth and Schmittgen (2001), and all values were normalized to the expression of the A. nidulans tubulin gene. C and D) Developmental studies performed under the same experimental conditions. In C, micrographs of conidiophores and cleistothecial primordia (white arrows) with a magnification showing Hülle cells (black arrow) surrounding the primordia. In D, quantification of conidia and Hülle cells. The error bars indicate the ranges for three replicates.

