
Figure 1.
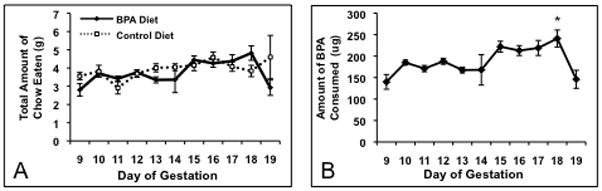
A) Mean food intake (± SEM) on each day of gestation starting at day 9 of pregnancy (E9). No significant differences in overall food intake between dams on the BPA (n=5) or control diets (n=8; p=0.45) were detected. B) Mean BPA intake (± SEM) for dams on the BPA diet. We noted an increase in BPA intake after E11 with a peak on E18. * BPA intake on E18 was significantly higher than E9 through E14 and E19 (p<0.004).