Figure 1.
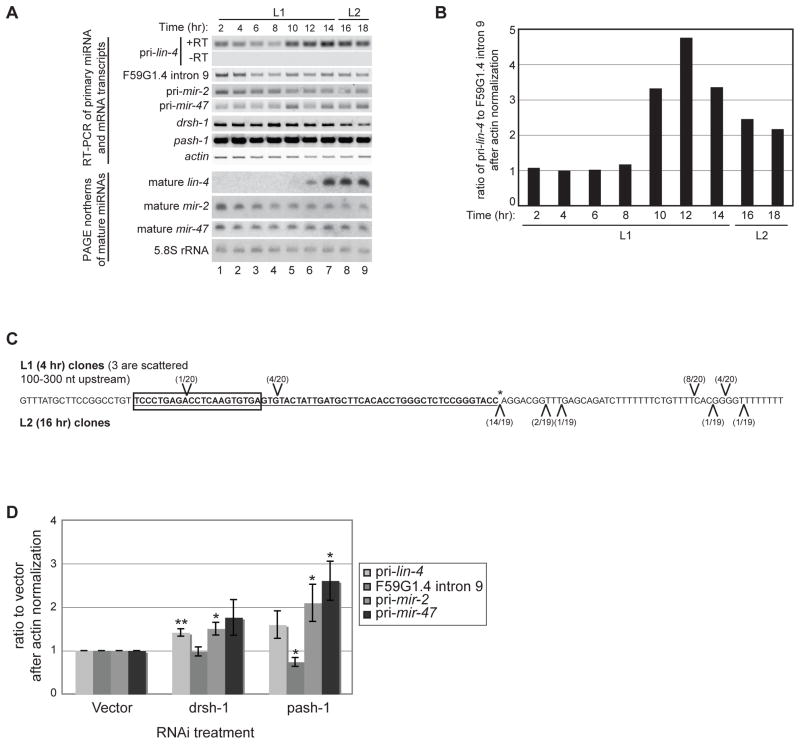
Developmental expression of lin-4 transcripts. (A) Total RNA was isolated from synchronized wild-type N2 worms during the L1 and L2 stages at 20°C. RT-PCR was used to detect the indicated primary, intronic, and protein-coding sequences. PAGE northern analyses were used to detect mature miRNAs or control 5.8S rRNA from the same RNA preparations used for the RT-PCR analyses. (B) Total RNA was isolated from synchronized wild-type N2 worms at the indicated time points. Levels of primary lin-4, F59G1.4 intron 9, and actin mRNA were analyzed by qPCR after reverse transcription with random primers. Representative analyses of the ratio of pri-lin-4 to F59G1.4 intron 9 after actin normalization from three independent experiments are shown. (C) Total RNA from 4 hour L1 (above sequence) and 16 hour L2 (below sequence) wild-type N2 worms was used in 5′ RNA oligo ligation reactions to map potential Drosha cleavage products. The oligo ligation positions identified by cloning and sequencing are indicated relative to pre-lin-4 (bold and underlined), mature lin-4 (boxed) and the expected 3′ Drosha cleavage site (asterisk). (D) Synchronized rrf-3(pk1426) worms were subjected to vector control, Drosha (drsh-1) or Pasha (pash-1) RNAi and collected at the L2 stage. Four independent samples from each RNAi treatment were analyzed by RT-PCR to detect miRNA primary, F59G1.4 intronic or actin RNA levels, as indicated. The average and s.e.m. of RNA levels in drsh-1 and pash-1 relative to control RNAi are graphed and were analyzed by Student’s t-tests (*, p<0.05; **, p<0.005).

