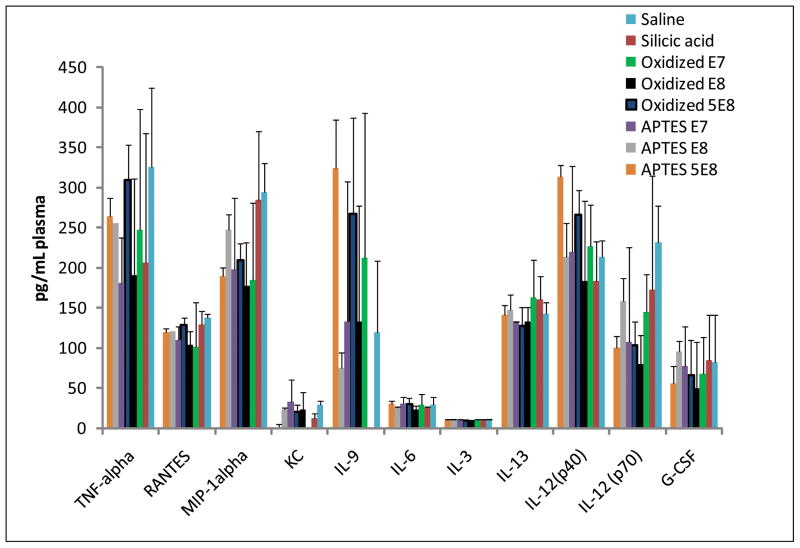
Figure 4.
Plasma cytokine levels 24 hours following single dose i.v. administration of various pSi S1MP nanovectors. The treatments included saline, silicic acid equivalent to the 5×10⁸ of the particles injected, negatively (oxidized) and positively (APTES) charged S1MP particles at the doses of 107, 108 and 5×10⁸ particles per mouse. The results are presented as mean ± S.D (n=4–6)

