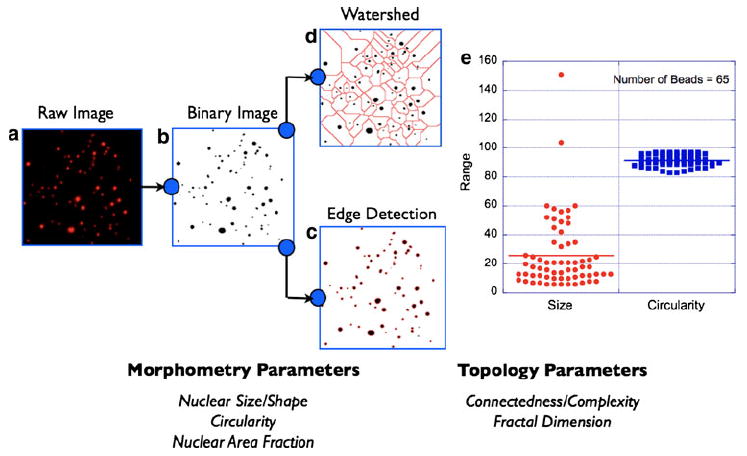
Fig. 1.

Nuclear morphometry/topology analysis schematic. A 2D image of fluorescent microbeads of various sizes is shown (a). This situation mimics the nuclear distribution in a typical tissue labeled with the intercalating dye, DAPI. Image segmentation process begins with intensity thresholding of the raw image (b). This step addresses the heterogeneity in fluorescence intensity across the field-of-view. The next step is to render the thresholded binary image to detailed morphometric analysis by either of the two methods: edge detection (c) or watershed algorithm (d). Morphometric parameters of relevance to this study are (i) nuclear size, (ii) nuclear circularity, and (iii) nuclear area fraction as defined in the text and exemplified in (e). In complex images where the nuclear area fraction is high, the above two image segmentation approaches can yield an underestimate of the calculated nuclear volume fractions. This situation occurs when the overlap of neighboring nuclei (e.g., tumor regions) exceeds the optical resolution of the imaging system (~0.25 μm). In order to address this inherent limitation, the processed images are also analyzed for topological information such as connectedness and fractal dimension. See main text for more details. Together, morphometric and topological analyses of the tissue fluorescence images provide a comprehensive picture of the tissue architecture
